An Output Metric is your leading KPI. Instead of getting hung up on which Output Metric is best for your team, select Output Metrics that make sense for your team's and staff's understanding. For example, a basketball team may use Jump Height, whereas a football team may use Peak Relative Propulsive Power. Both represent the outcome of the jump and correlate very closely. -Drake Berberet, Director of Sport Science
Setting It Up
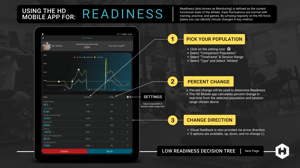
Readiness monitoring is seamless with the Hawkin Dynamics Mobile Software. First, you will want to set up your HD Mobile Software to Readiness settings. Click settings (the wheel icon) in the top right-hand corner from the athlete test page. Once open, set your comparison population to "Self" and date range to "Last 5 Sessions". Your average that is displayed in the middle column will now reflect the athlete's moving average for the last 5-sessions. *Note that it is imperative to test regularly to gain a true understanding of readiness day-to-day.
We suggest using the percent change method of assessing an athlete's readiness because it is simple to use, and quick to digest for both the practitioner and athlete. In the third column, you will see the percent change from the first column (your selected test) to the second column (the set average from above). In the fourth column, an arrow will represent the direction of change for that given metric. If the change is 0% there will be a flat line shown.
*If you prefer using Z-Scores or Modified Z-Scores our HD Cloud (computer) App quickly displays those as well.
Traffic Light System (Using Percent Change)

The concept of using percent change to dictate readiness is a concept that I was first introduced to by Matt Van Dyke, who is currently a Sport Scientist for the Houston Texans football team. The original article can be found here.
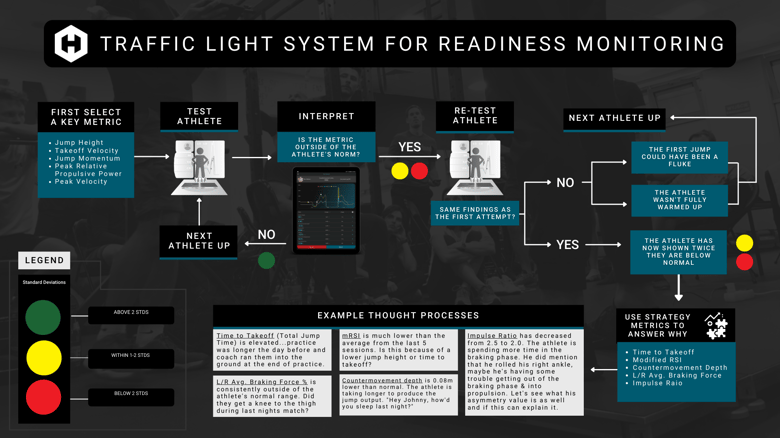
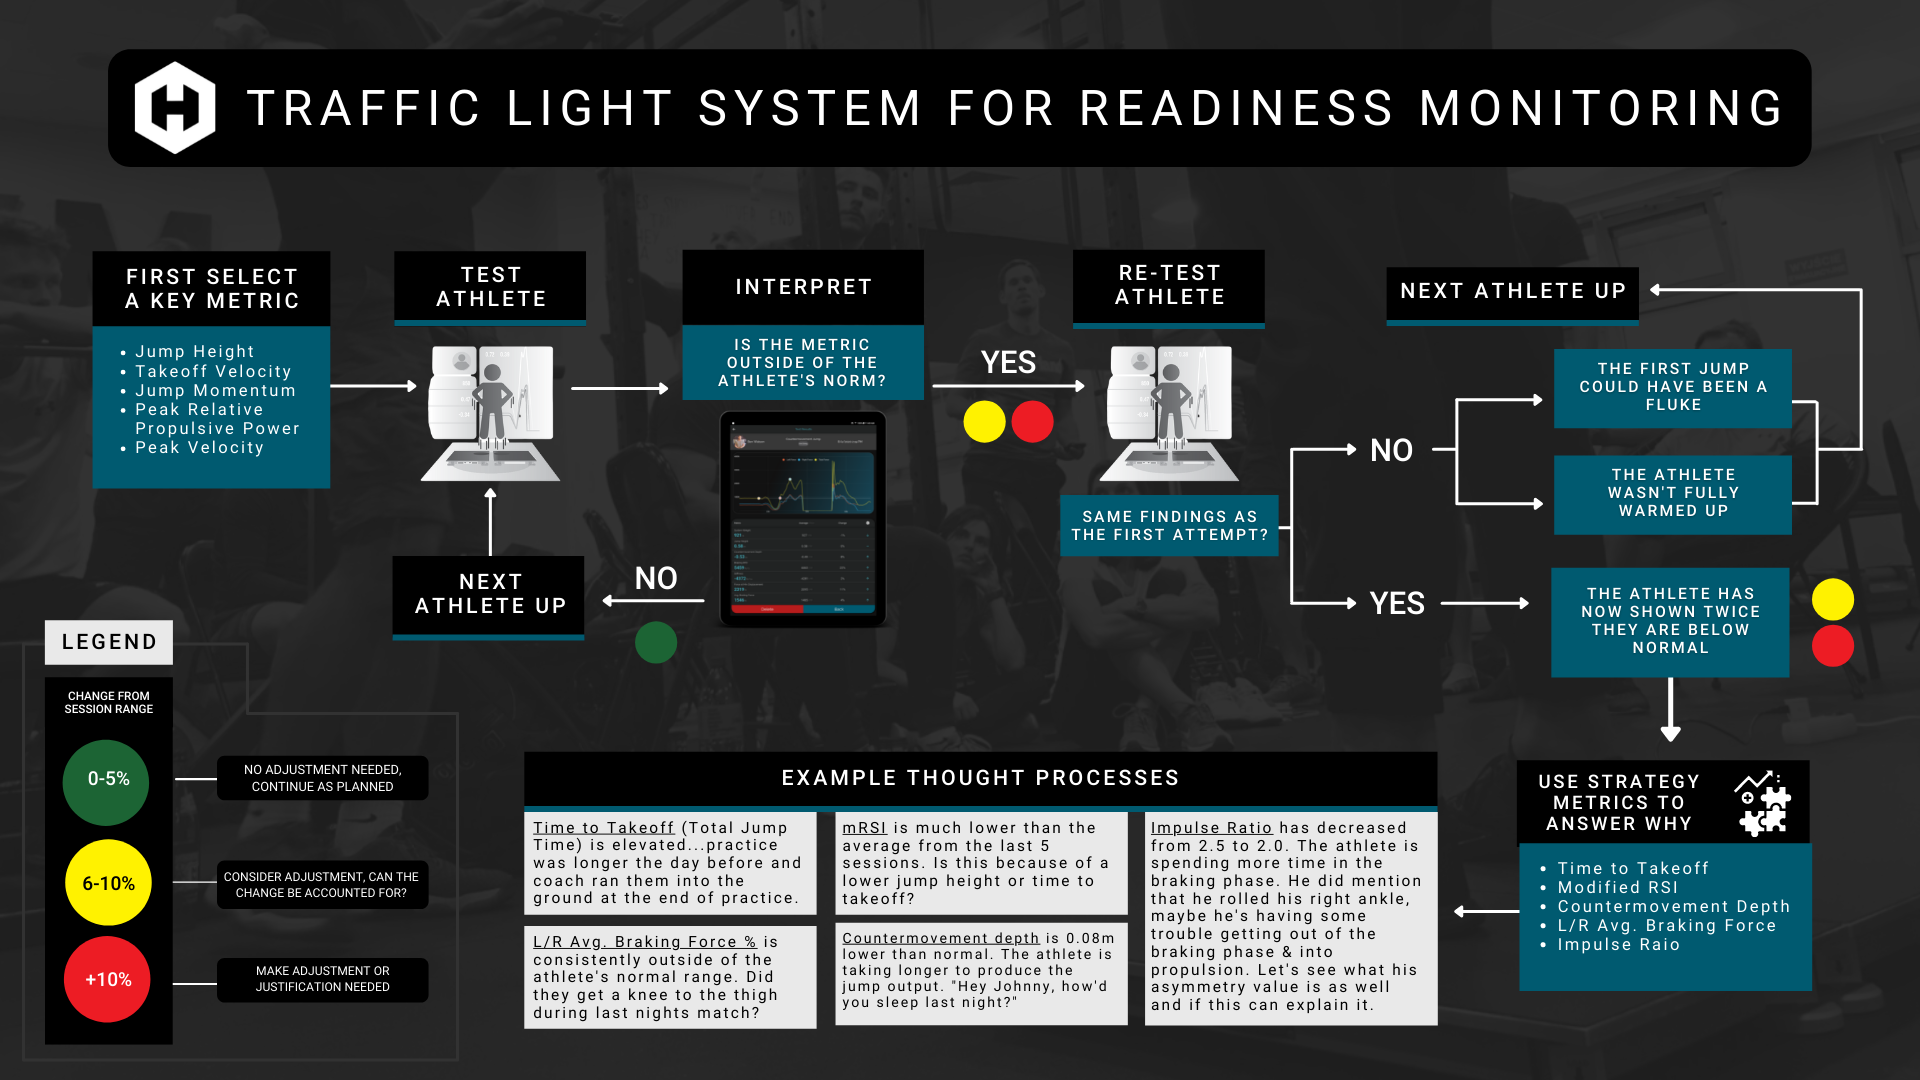
Using this percent change model for readiness, green would indicate a 0-5% change from the baseline (which is typically the moving average for the last 5-sessions as selected above). A 0-5% change in the negative direction would indicate normal human fluctuation from day-to-day. Meaning that we are accepting some minor discrepancies as part of being human and playing sport/training regularly + other life stressors.
6-10% (really 5.1% to 10%) indicates that the change is now more significant because it is above what we would deem normal daily fluctuation. Yellow is taken more seriously than green, but not as seriously as red. With green, we move on to the next athlete, whereas with yellow we ask the athlete to jump again. If the athlete reproduces another yellow decrement, then our confidence is higher that the athlete is actually worse than expected. Yellow is not red. With red (change of over 10%) it is almost a certain change of action. Meaning that the athlete is now significantly lower for their readiness metric, and the athlete will not carry on as normally planned. The athlete may instead go to athletic training, perform a more recovery-focused workout, or not train at all for the day. Whereas with yellow the changes in training become the discretion of the practitioner. By this I mean that the practitioner typically has a good idea of what is taking place outside of the weight room, and also the volume in practice/games. They have a lot more context. Using the force plate first as a check engine light for readiness, and then applying context to the situation is the best formula for assessing readiness.
In the picture above, I have included example thought processes for using force plate metrics along with outside context to help guide the decision-making process for determining an athlete's readiness.
Common Readiness Metrics:
-
Jump Height (calculated from takeoff velocity)
-
Takeoff Velocity, Peak Velocity
-
Jump Momentum (mass * takeoff velocity)
-
Peak Relative Propulsive Power (Watts/Kg)
-
Modified Reactive Strength Index (mRSI) (Jump height/Time to Takeoff)
Have any questions about how you should set up readiness for your athletes? Reach out to Drake at drake@hawkindynamics.com.
-2.png?width=156&height=60&name=Hawkin%20Logo%20(2)-2.png)
-1.png?width=155&height=60&name=WHITE.Horizontal_Logo.Transparent%20(3)-1.png)

