-2.png?width=156&height=60&name=Hawkin%20Logo%20(2)-2.png)
After seeing the limitations of hand-held dynamometry, coupled with the knowledge and expertise from Hawkin Dynamics on force plates, we saw an extraordinary opportunity for the Hawkin TruStrength!

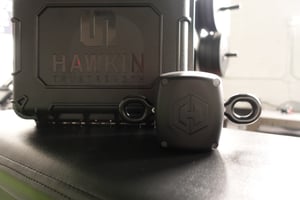
What is Hawkin TruStrength?
Hawkin TruStrength is a portable fixed dynamometer, designed to provide users with highly valid and reliable data. Inside the TruStrength, you will find a load cell, which is a type of transducer that converts an imparted mechanical load into an electrical output that is linearly proportional to the applied force. Simply put you have a device that can measure both pulling (tensile) and pushing (compressive forces) (see Figure 1).

Figure 1: Hawkin TruStrength measuring tensile and compressive force.
What are the Hawkin TruStrength Specs?
Let’s find out a little more about TruStrength, specifically what’s under the resistant casing. Take a look (Table 1) at some of the specs this device has to offer:
Table 1. Hawkin TruStrength Specs.
|
Size |
105 W x 80 H x 95 D mm |
|
Weight |
1.7 lbs (800g) |
|
Sensor Type |
Load Cell |
|
Resolution |
1 N |
|
Forces |
Measures both tensile and compressive forces |
|
Capacity |
10,000 N / 1,000 kg Tensile and Compression |
|
Sampling Rate |
1,200 Hz |
| Metrics |
|
The TruStrength offers a load capacity of 10,000 N, a sampling frequency of 1,200 Hz, and a resolution of 1 N, meaning it can measure changes in force to the magnitude of 100 grams. This means that the technology is sensitive enough to measure the changes in most exercises that you are interested in, whether it be in the clinic with the injured or on the sporting field with the strongest of athletes.
Capturing Accurate Data: Technological and Biological Variability
The TruStrength device has you covered when it comes to capturing the most accurate and reliable data on your athletes, clients, and patients. When we use our technology, we assume that the readings will be the same, however, this is not always the case. If you are collecting at high sampling rates, in this case 1,200 Hz, there may be drift. Furthermore, this technological variability can be affected by the way you hold or attach the device, temperature changes, and sensor aging. The TruStrength device has a zeroing function which helps eliminate any of these biases and ensures you start from a known constant value at baseline i.e., zero.
Biological variation consists of factors involving the athlete/client, and in the case of hand-held dynamometry, the tester/user. TruStrength removes this tester/user variability by being designed to attach to objects such as a rack, plinth, base plate, etc., thus the term portable fixed dynamometer. The TruStrength can be stabilized using the available rack mount or floor mount accessories (see Figure 2), which secure the load cell at one end, thereby improving the reliability and accuracy of your data collection, by removing signal artifacts produced by holding the sensor. Additionally, Hawkin Dynamics offers comprehensive support through its knowledgeable staff and digital educational resources, ensuring that users can collect reliable data for the most impactful tests.

 Figure 2: Hawkin TruStrength shown attached to small base plate, rack, and IMTP system.
Hawkin TruStrength the “Swiss Army Knife” of Dynamometers
Hawkin TruStrength device is a small solution with a big impact. We have developed protocols for all body parts (see Figure 3) that can be used by both strength and conditioning practitioners and physiotherapists. The research team at Hawkin is continuously determining the reliability of these protocols, to ensure you can collect data that you know reflects changes in your athletes, clients, or patients' force capability. Take a look at some of the research we have published using the Hawkin TruStrength device.

Figure 3: The body parts that TruStrength can assess
Here is a quick summary of the research. To get a full picture of reliability, we look at the change in the mean, intra-class correlation coefficient (ICC), and coefficient of variation (CV) [1]. The ICC value can be interpreted as follows: ‘very poor’ (<0.20), ‘poor’ (0.20-0.49), ‘moderate’ (0.50 – 0.74), ‘good’ (0.75 – 0.90) or ‘excellent’ (>0.90) [1, 2]. The CV value was considered acceptable if below 10% [3]. We also look at the within-session i.e., the variability between trials, and between-session i.e., the variability between testing occasions. Of most interest is the between-session reliability i.e., how reliable is TruStrength across various testing occasions (across several weeks). Below is a brief insight into our between-session reliability results for peak force across various assessments (see Table 2).
Table 2: Between-session reliability of peak force for different protocols.
|
Peak Force |
ICCs |
CV (%) |
|
Isometric mid-thigh pull [4] |
0.94-0.98 |
4.6-7.9 |
|
Neck Retraction [5] |
0.80-0.85 |
5.3-7.1 |
|
Groin Squeeze [6] |
0.83-0.86 |
8.9-9.5 |
|
90:90 Hamstring [7] |
0.95 |
6.5-6.7 |
|
90:20 Hamstring [7] |
0.93-0.97 |
6.3-8.9 |
|
Standing Hamstring [7] |
0.91-0.94 |
5.9-7.8 |
|
Knee Extension (at 90°) [8] |
0.93 |
5.5-6.3 |
|
Harness Squat* |
0.94-0.95 |
5.22-6.66 |
|
Seated Plantar Flexion* |
0.96-0.99 |
3.0-6.4 |
|
Dynamic Plantar Flexion (Neutral)* |
0.93-0.96 |
3.0-3.9 |
|
Dynamic Plantar Flexion (Dorsi-flexed) * |
0.90-0.96 |
3.5-5.3 |
* = In review
We have more research coming out soon, so make sure you keep an eye out! Also, we are helping practitioners to develop and publish their bespoke protocols, so reach out if you need a hand.
Keeping it Simple
With Hawkin TruStrength, we have kept the metrics that we report on to a minimum, which you can utilize at different stages of rehabilitation or different stages of programming depending on your goals. We will follow up with more blog posts on how you can utilize these metrics, so watch out for those!
References:
Hopkins, W.G., Measures of reliability in sports medicine and science. Sports Medicine, 2000. 30: p. 1-15.Koo, T.K. and M.Y. Li, A guideline of selecting and reporting intraclass correlation coefficients for reliability research. Journal of chiropractic medicine, 2016. 15(2): p. 155-163.
Lloyd, R.S., et al., Reliability and validity of field-based measures of leg stiffness and reactive strength index in youths. Journal of Sports Sciences, 2009. 27(14): p. 1565-1573.
Pichardo, A.W., et al., Validity and Reliability of Force-Time Characteristics Using a Portable Load Cell for the Isometric Midthigh Pull. The Journal of Strength & Conditioning Research, 2024. 38(1): p. 185-191.
Burkitt, J., et al., Intrasession and Intersession Reliability of Neck Retraction Strength Using a Strain Gauge Device. Journal of Sport Rehabilitation, 2025. 1(aop): p. 1-6.
McMinn, K.J., et al., Inter‐and intra‐session variability of compression strain gauge for the adductor groin squeeze test on soccer athletes. Healthcare Technology Letters, 2024. 11(1): p. 16-20.
Woodbridge, R., et al., Reliability of a Portable Fixed Dynamometer During Different Isometric Hamstring Assessments. Applied Sciences, 2024. 14(22): p. 10202.
Juneau, C.M., et al., Intersession variability of knee extension kinetics using a strain gauge device with differing clinically practical physical constraints. Journal of Sport Rehabilitation, 2022. 32(1): p. 96-101.